
Analytics API
From raw data to financial-grade insights
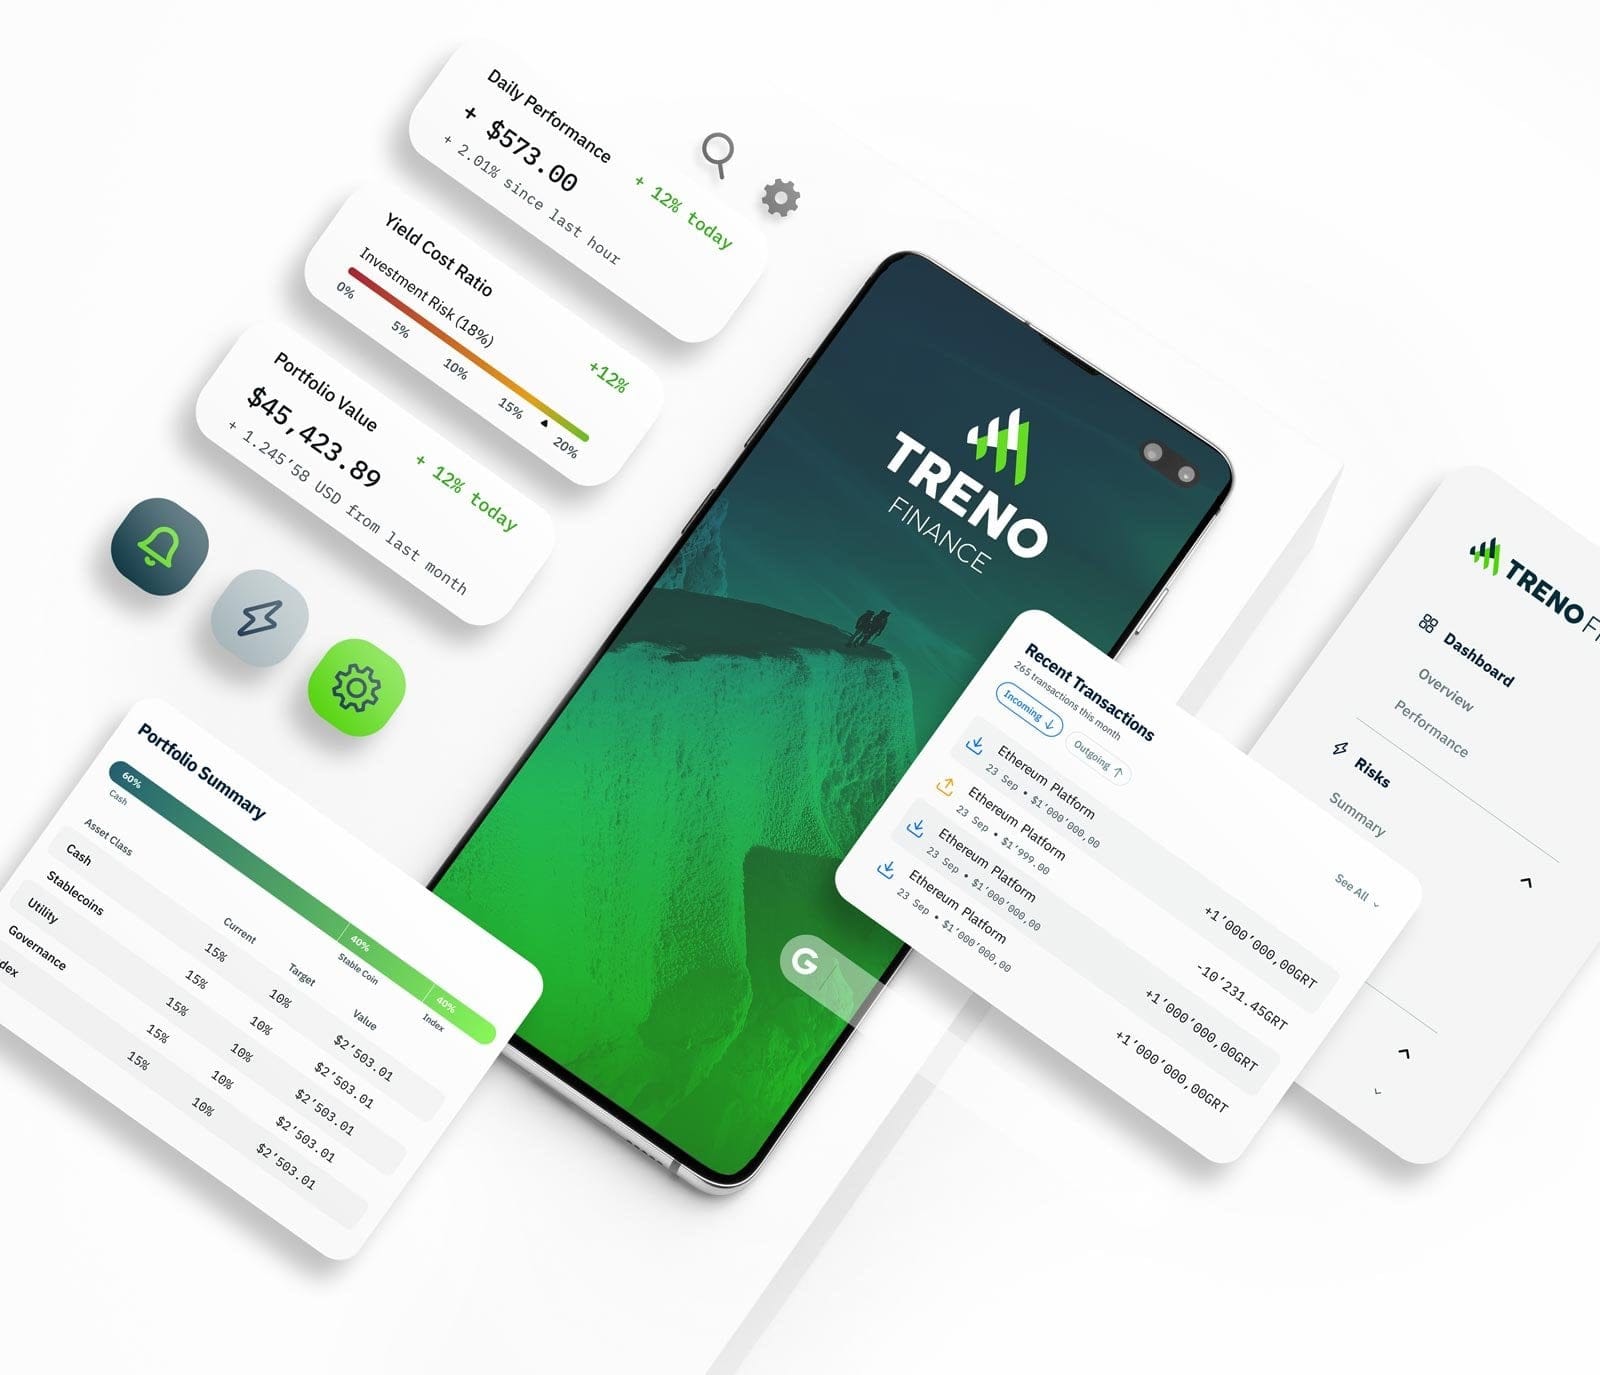
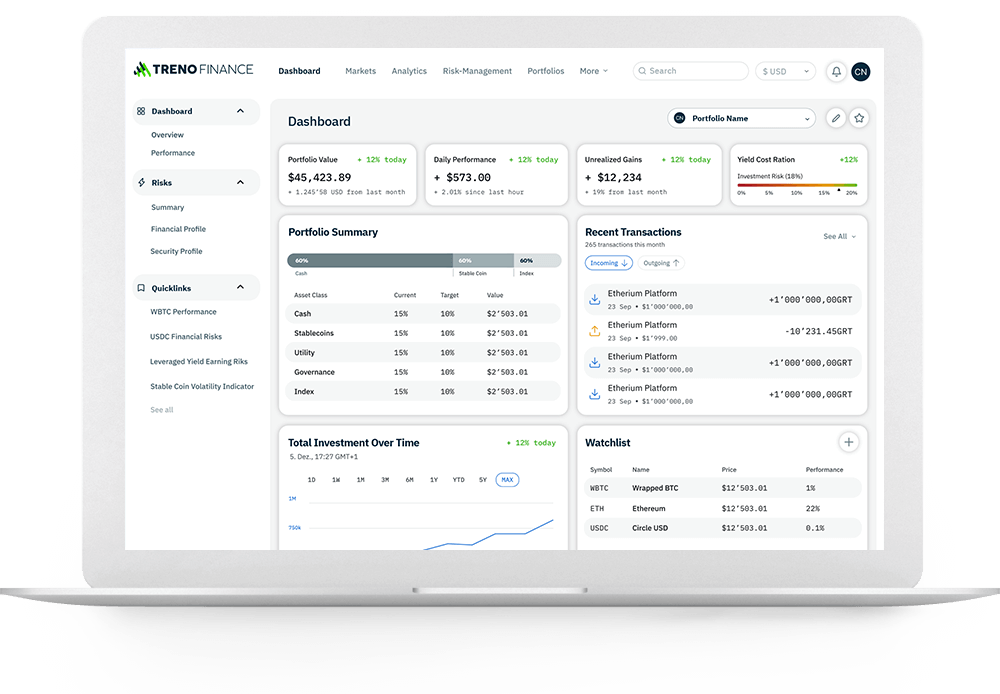
Gain real-time access to portfolios, risk reports, PDF exports, benchmarks, and asset analytics. Seamlessly integrate with your applications, Excel workflows, or custom dashboards - all built on an API-first architecture.
Analytics for Experts
Designed for developers, financial analysts, and crypto-native investors, our API delivers structured financial risk data without overwhelming technical complexity. Analyze portfolios, benchmark performance, and monitor risk across multiple assets and networks - all with the precision financial professionals expect.
What to expect
Manage
Go beyond single wallets
Structure, monitor, and manage assets across multi-portfolio environments, minimizing distortions from internal movements.
- Multi-Wallet & Multi-Portfolio Management
- Base Currency & FX Risk Monitoring
- Advanced Tagging & Access Controls
- Automated Internal Transaction Detection
- Seamless Asset Consolidation
Analyze
Data-Driven Investment Optimization
Turn raw blockchain activity into actionable financial insights for better decision-making.
- Opportunity Cost & Lending Comparisons
- Competitive Platform Benchmarking
- Market Index & Strategy Alignment
- Deep Risk Metrics Beyond Simple ROI
Report
Transparent & Actionable Reporting
Build trust with structured reporting - aligned with financial best practices.
- Transaction Transparency & Cost Attribution
- Realized Gains & Losses Calculation
- Automated Tax Reporting & Compliance Exports
- Comprehensive Risk Exposure Reports
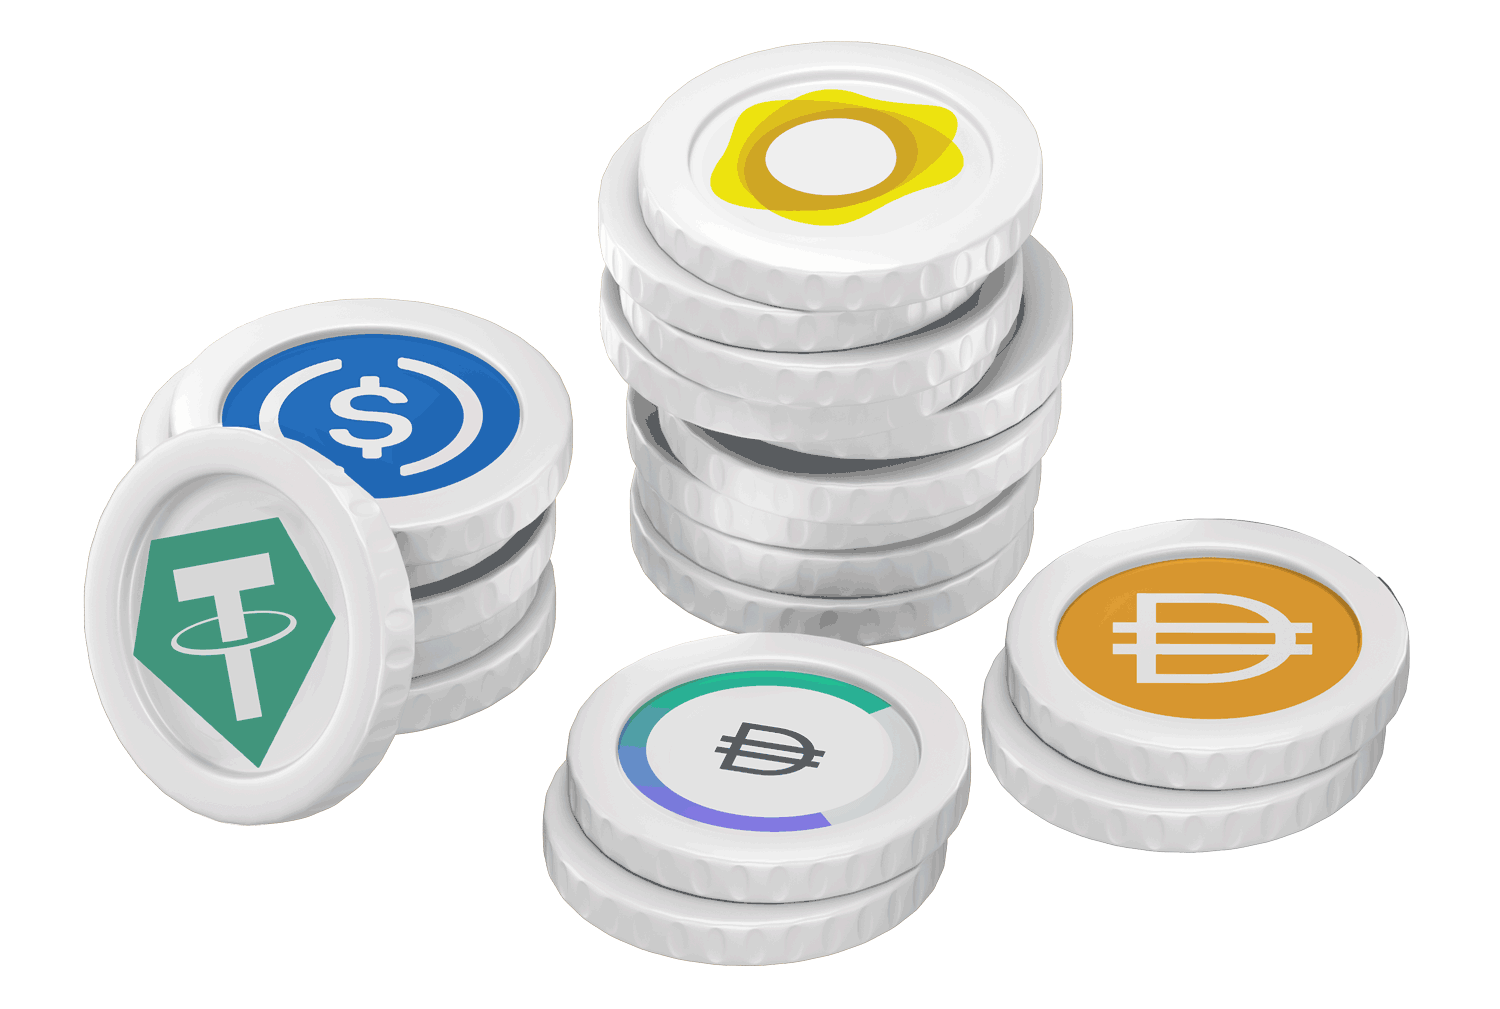
Comprehensive Asset Support
Our analytics prioritize reliable, finance-ready data from bluechip stablecoins, derivatives, and yield opportunities. By focusing on high-liquidity assets, we ensure data consistency for critical portfolio decisions.
While optimized for major assets, the API also enables data retrieval for a broad range of cryptocurrencies - supporting comprehensive cross-chain portfolio analysis. Manual tracking for non-EVM assets is possible through virtual account management.
Real-Time DeFi Insights
Stay ahead in the DeFi landscape with real-time protocol data from platforms like Aave. Monitor market prices, yield rates, liquidity flows, and risk indicators - all updated continuously to support agile decision-making.
Protocol Signals
Lending markets reveal deeper insights beyond yields - exposing shifts in market sentiment, liquidity stress, and systemic risks.
Interest Rate Dynamics
Shifting rates across stablecoins and volatile assets indicate changing liquidity and risk appetite.
Segmented Risk Profiles
Platforms like Aave, Compound, and Spark differentiate by collateral type and user demographics, offering natural market segmentation.
Live Monitoring
Access real-time lending rates, utilization metrics, and dynamic protocol risk assessments to stay informed.
Aave, Compound & Spark
Monitor live rates, protocol health, and asset-level exposure.
Coming Soon: Lido & Rocket Pool
Gain insights into validator activity, staking yields, and security metrics.
Protocol Health Monitoring
Understand the real strength of lending and staking ecosystems through structured data signals.
Easy Integration
With Excel & Spreadsheets
➔ Connect
Import real-time analytics into Excel or Google Sheets to create custom investment tools.
➔ Seamless Workflow
Integrate data dynamically into your spreadsheets using add-ons and standard HTTP requests.
➔ Build Analytics
Construct your own calculators, track market signals, and automate risk monitoring.
➔ Dynamic Data Refresh
Keep dashboards and models continuously updated without manual intervention.
With Websites & Apps
➔ Flexible API Access
Embed real-time financial risk data into websites, dashboards, or mobile apps.
➔ Comprehensive Data Coverage
Access detailed analytics across portfolios, assets, protocols, and yield strategies.
➔ Developer-First Approach
Use our clear API documentation, code examples, and support channels for fast, frictionless integration.
Built for Data Science & Machine Learning
Just train, we handle the data
➔ Ready out of the box
We deliver curated DeFi lending time series: clean, consistent, clearly labeled.
➔ No scraping, no cleaning
Collection, normalization, and QA are done. You start directly with training.
➔ Point‑in‑time and historical
Bias‑free, point‑in‑time data with full history for trustworthy backtests.
➔ Relevant signals included
Rates, utilization, spreads, TVL, liquidations, LTV levels, user activity, token prices/volatility, governance changes, incidents, and more.
➔ From idea to model fast
Use the data for forecasting, risk scoring, anomaly detection, and scenario analysis.
Simple workflow
➔ Easy formats
CSV/JSON for direct use in notebooks, Excel/Sheets, or BI tools.
➔ Unified schemas
Same columns and cadence (daily/sub‑daily) across assets, markets, and protocols.
➔ Reproducible
Versioned snapshots so results remain comparable over time.
➔ Flexible selection
Pull exactly the markets/assets/time ranges you need for training.
➔ Quick integration
Add API key, choose dataset, pick features - train.
Model Context Protocol
Connect your portfolio data with AI assistants like Claude and Cursor via our MCP server.
"How is my portfolio doing?"
Stateless & Secure
Transform your crypto data into actionable insights for your AI workflows. Treno's MCP integration bridges raw data with AI logic:
Natural Language Queries
Ask your AI about portfolio balances, performance, or transactions without leaving your IDE or chat.
Developer-First
Stateless, high-speed HTTP endpoint optimized for seamless integration into Cursor, Claude Desktop, and your own AI agents.
Secure & Stateless
Independent authentication for every request via a Bearer token. Maximum security with zero session overhead.
Ready for 2025
Fully compatible with the latest MCP specifications. Supports standard discovery via llms.txt.
FAQ
Many blockchain analytics APIs are overly technical and require deep blockchain knowledge. At Treno, we take a financial-first approach. We deliver the essential data professional investors expect - like current asset valuations, acquisition values, and portfolio growth - without the need to manually decode complex blockchain transactions. Our API focuses on what matters for investment analysis. We explain these limitations in our on-chain data analysis.
Integration is straightforward. Our API uses a simple API key authentication via query parameters and returns clean JSON data. With full documentation and a built-in Swagger playground in the user portal, you can easily test and experiment with endpoints. Excel and Google Sheets integration is also supported, making it simple to build custom charts and reports with live data. Create your API key here and start using your data in any application you like.
Yes. You can create multiple accounts, each tied to a wallet address, and combine them into a single portfolio view. Our system aggregates all assets across wallets and networks (currently EVM-compatible chains) to give you a true consolidated overview - recognizing internal movements to avoid double-counting or distortions. Learn more about portfolio management.
Our risk indicators combine quantitative and qualitative data. While quantitative risks are calculated, qualitative risks are evaluated in context - for example, "asset A is riskier than asset B" - based on structured analysis methods. Data freshness depends on your subscription tier: Free users get daily updates, while Pro users benefit from dynamically updated data with intelligent caching for optimized speed and relevance. Learn more about our risk assessments.
Assets on non-EVM chains - and even non-crypto assets like precious metals or cash holdings - can be managed through virtual accounts. You can manually track movements, and we source price data from CoinGecko to cover most tradeable assets. This ensures that even off-chain holdings can be incorporated into your portfolio view.